外观
Skip to content
此页内容
blogs
排名图表展示
需求
一个全国各省数据从高到低排列的图表,默认显示前十条,向下滚动可以继续展示更多数据,echarts图表很难实现需求图的一比一还原,所以手绘的还原度会更高。
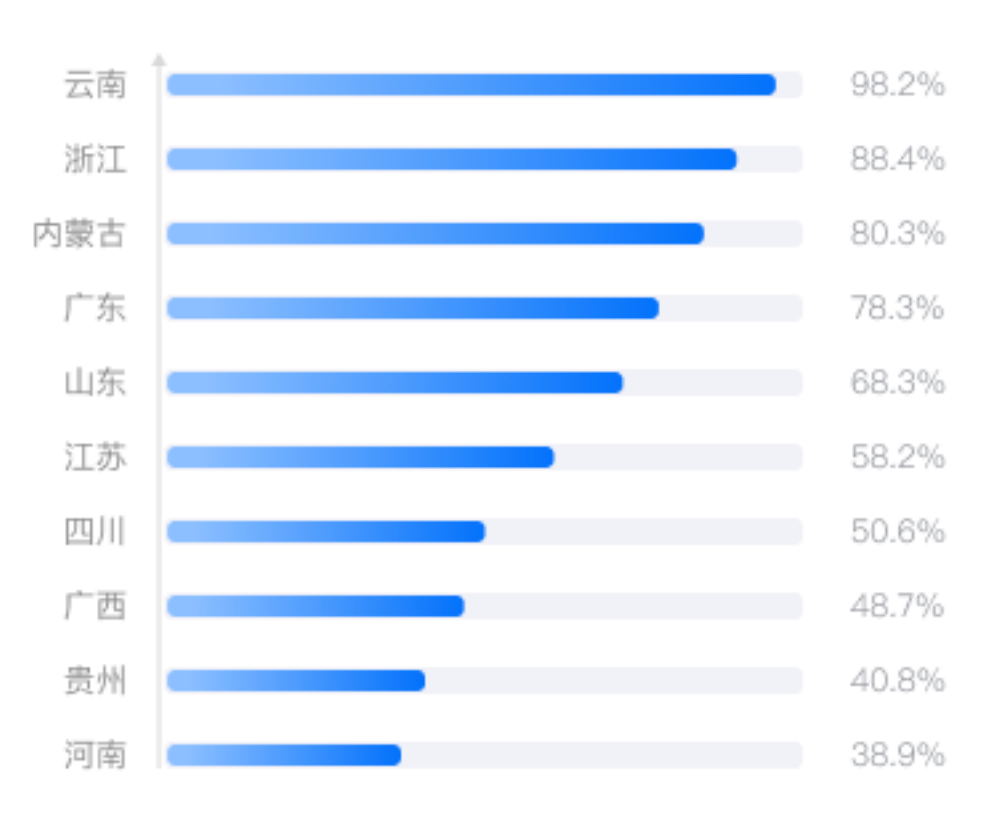
手绘方案
<template>
<div class="area-index" :key="tradeStamp" v-if="showEcharts6">
<div class="vertical-line">
<div class="triangle-top"></div>
</div>
<div class="every-his">
<div
v-for="(item, index) in trdAreaAnalysisData.list_tra"
:key="index"
class="every-his-item"
>
<div class="item-name">{{ item.prov }}</div>
<div class="item-block">
<div
:style="{
width:
(item.set_amt / trdAreaAnalysisData.max_tra) * 95 + '%',
}"
></div>
</div>
<div class="item-value">{{ item.set_amt.toFixed(2) }}</div>
</div>
</div>
</div>
</template>
<style scoped lang="scss">
.area-index {
width: 100%;
height: calc(100% - 150px);
overflow-y: auto;
position: relative;
.vertical-line {
position: relative;
width: 2px;
height: 300%;
background-color: #ccc;
margin: 10px 100px;
z-index: 999;
.triangle-top {
position: absolute;
top: -8px;
left: 50%;
transform: translateX(-50%);
width: 0;
height: 0;
border-left: 8px solid transparent;
border-right: 8px solid transparent;
border-bottom: 8px solid #ccc;
/* 三角形底部颜色与竖线一致 */
}
}
.every-his {
position: absolute;
top: 0;
width: 100%;
height: 95%;
margin-top: 2%;
.every-his-item {
display: flex;
height: 10%;
align-items: center;
.item-name {
width: 90px;
text-align: right;
}
.item-block {
width: calc(100% - 200px);
height: 10px;
border-radius: 3px;
background: #f1f1f8;
margin-left: 15px;
position: relative;
div {
position: absolute;
top: 0;
left: 0;
background-image: linear-gradient(to right, #96c4fe, #0472fb);
border-radius: 3px;
height: 10px;
}
}
.item-value {
width: 50px;
margin-left: 20px;
}
}
}
}
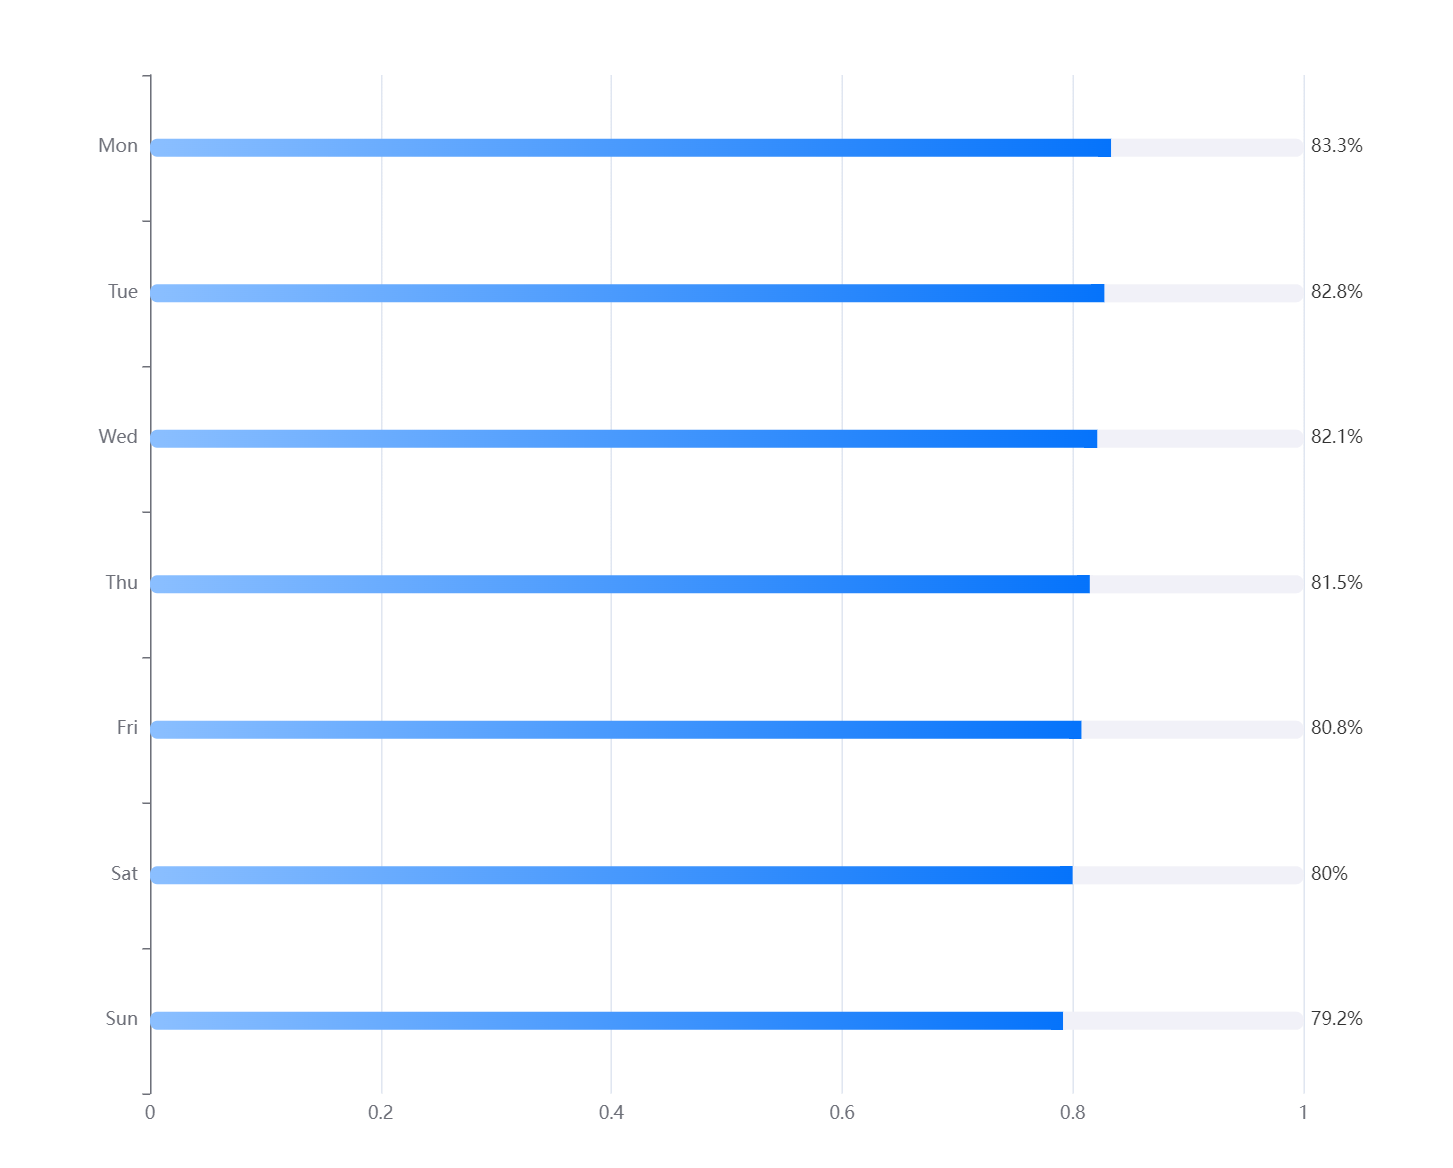
</style>echarts方案(还原度不够,慎用)
const rawData = [
  [500, 480, 460, 440, 420, 400, 380],
  [100, 100, 100, 100, 100, 100, 100]
];
const totalData = [];
for (let i = 0; i < rawData[0].length; ++i) {
  let sum = 0;
  for (let j = 0; j < rawData.length; ++j) {
    sum += rawData[j][i];
  }
  totalData.push(sum);
}
const grid = {
  left: 100,
  right: 100,
  top: 50,
  bottom: 50
};
const series = ['Direct', 'Mail Ad'].map((name, sid) => {
  return {
    name,
    type: 'bar',
    stack: 'total',
    barWidth: '12px',
    itemStyle: {
      borderRadius: name == 'Direct' ? [5, 0, 0, 5] : [0, 5, 5, 0],
      color:
        name == 'Direct'
          ? new echarts.graphic.LinearGradient(0, 1, 1, 0, [
              { offset: 0, color: '#8BBFFF' },
              { offset: 1, color: '#0573FB' }
            ])
          : '#F1F1F8'
    },
    label: {
      show: name == 'Direct' ? false : true,
      position: 'right',
      formatter: (params) => {
        return Math.round((1 - params.value) * 1000) / 10 + '%';
      }
    },
    data: rawData[sid].map((d, did) =>
      totalData[did] <= 0 ? 0 : d / totalData[did]
    ).reverse()
  };
});

option = {
  grid,
  xAxis: {
    type: 'value',
  },
  //
  yAxis: {
    type: 'category',
    data: ['Mon', 'Tue', 'Wed', 'Thu', 'Fri', 'Sat', 'Sun'].reverse()
  },
  tooltip: {
    trigger: 'axis',
    axisPointer: {
      type: 'shadow'
    },
    formatter: function (params) {
      var tooltipText = params[0].name + '<br/>';
      var total = 0;
      for (var i = 0, len = params.length; i < len; i++) {
        total += params[i].value;
      }
      tooltipText +=
        '<span style="display:inline-block;width:8px;height:8px;background-color:' +
        '#5470C6' +
        ';border-radius:50%;margin-right:5px;"></span>' +
        params[0].seriesName +
        ': ' +
        ((params[0].value / total) * 100).toFixed(2) +
        '%';
      return tooltipText;
    }
  },
  series
};